
Join us in building a fintech company that provides fast and easy access to credit for small and medium sized businesses — like a bank, but without the white collars. You’ll work on software wiring million of euros, every day, to our customers.
We’re looking for both junior and experienced software developers.
At Floryn we have many marketing channels that we spend a lot of money on, so getting the maximum effect out of these channels can make a big difference to the bottom line. We went with an approach that focuses on getting our data in-house, not depending on too many external tools for analysis, and really understanding what’s going on by modelling the information ourselves.
The key component to all of this is the data warehouse. This allows you to be in control of the data that you pull in and combine it in whichever way you prefer. You also have the power to let other ‘downstream’ users make good use of the data, such as our Machine Learning Engineers and Data Scientists.
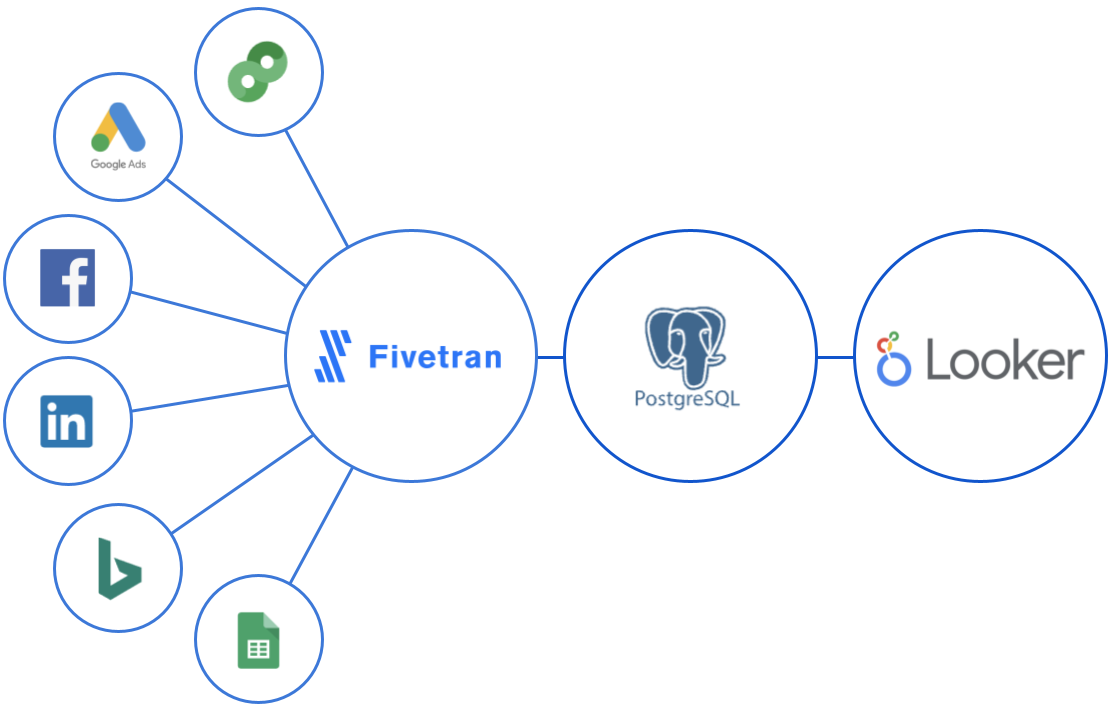
A data warehouse can be surprisingly simple, we use PostgreSQL as our data warehouse. It’s a standard relation database that contains copies of all the important data from different systems, so that we can use it for reporting. We’re very familiar with the technology and it scales well for our use cases. We know there are many cooler database technologies around, but we’ll cross that bridge when we need to.
We use a hosted BI tool called Looker, to build our reports and design our data model. Looker works really well for us, since we love working with relational data and we have people who are great with SQL. The data warehouse does allow you to be independent, since any BI tool that can work with PL/SQL can use it. So if we decide to go with a different approach we still have the flexibility to do so.
The main advantage of using Looker for our reporting, over more UI oriented tools like Mixpanel, Amplitude or other specific SaaS tools, is that these tools are mostly good at some specific use case, such as marketing, user behaviour or accounting data. We love to combine all of these use cases. Of course we still choose these specific tools over our Looker Swiss army knife where it makes sense.
Our goal is to combine all the marketing costs of LinkedIn, Google Ads, DoubleClick, Facebook and Bing Ads. So that we can combine these channels in a single report and compare them. We also built a connection with our internal accounting system to measure offline campaigns such as direct mailings. We use a great tool called Fivetran that maintains connections with all these different ad platforms for us and makes sure the data ends up nice and clean in our data warehouse.
The important challenge is mapping all these different sources to the same terminology. We use Looker PDTs (Persistent Derived Tables) for this. PDTs allow you to persist queries in tables on your database, so they can be queried efficiently afterwards.
The simplified example below combines four different columns from Adwords and Linkedin by renaming them and using a union:
SELECT
    adwords.date_start as date,
    'adwords' as source
    adwords.campaigns_id as campaign_id,
    SUM(adwords.costs) as costs,
    [...]
    GROUP BY 1, 2, 3
UNION ALL
SELECT
    linkedin.day as date
    'linkedin' as source,
    [...]
UNION ALL
    [...]
Using this method we’ve pulled in data from different marketing sources and stored them in our data warehouse as tables. We’ve used Looker to define a new data model on top of these tables and combined them in a single table using PDTs, allowing us to easily query it.
We’ve since expanded this method to include different attribution models, pulled in more data like impressions and clicks, and also synced costs from our accounting system in exactly the same way. With an attribution model this data can be connected to other data on clients, such as their behaviour, page views and credit score. This allows our marketing department to know where to spend their budget with maximum effect.
Floryn is a fast growing Dutch fintech, we provide loans to companies with the best customer experience and service, completely online. We use our own bespoke credit models built on banking data, supported by AI & Machine Learning.
