
Join us in building a fintech company that provides fast and easy access to credit for small and medium sized businesses — like a bank, but without the white collars. You’ll work on software wiring million of euros, every day, to our customers.
We’re looking for both junior and experienced software developers.
Floryn uses machine learning to automate credit decisions. This automation not only caters for more effective choices, but also allows us to scale risk mitigation functions by freeing credit underwriters from significant amounts of ungainly manual work.
To maintain loans over time, we need to decide how and when to increase, decrease or reset customers’ credit limit in a way that reflects their financial status. This is an optimization exercise aimed at maximising profit, while mitigating the risk of potential losses. To that end, we run a review system in which customers are required to periodically provide their bank transactions. This data is then used to estimate financial KPIs, such as revenue and cash balance, such that credit underwriters can review the customer’s financial performance.
From a technical standpoint, this boils down to a binary classification problem. Assuming that past data can indicate performance in the future, the aim is to distinguish between good and bad credit, and typically the target is whether a borrower will default or not.
The financial data at hand come in the form of time series. In data science, time series learning tasks are among the most challenging problems, as most machine learning algorithms are not inherently aware of the time dimension. We therefore had to develop a proper strategy to process the vast amount of data available and select the algorithms that would fit the problem best.
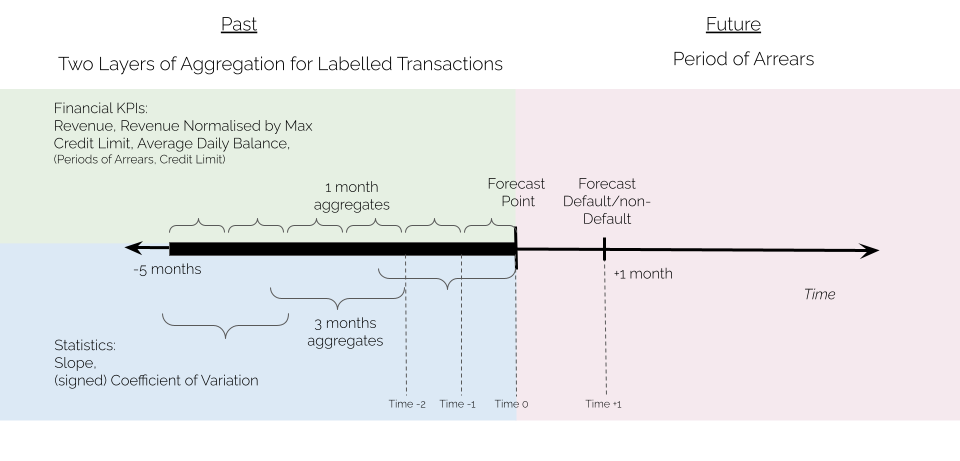
A technique repeatedly used to frame a time series task as a supervised learning problem is called ‘reduction’. Essentially, time series are lagged to be ‘reduced’ to a tabular dataset that encodes the time series task at hand. As a result, each row is a set of past observations of the features and future observations of the target.
In addition to lagging, when using reduction, time series are often pre-processed to extract meaningful features. This allows us to reduce the volume of data but also to capture exciting patterns. Usually, features come in the form of statistical operators applied to the time series, such as the maximum, the mean, or the median operators. These feature maps can be applied to a full time series or combined with sliding and rolling windowing operators. Figure 1 shows how reduction has been applied in this context.
We adopted tree-based models to learn the defined nonlinear mapping to predict the probability of default one month ahead; specifically, a Random Forest and a Decision Tree. Both models have shown great predictive value with the Random Forest scoring the highest.
The probability estimates produced as output of the trained Random Forest have been used to allocate customers into three different risk zones: low, medium and high.
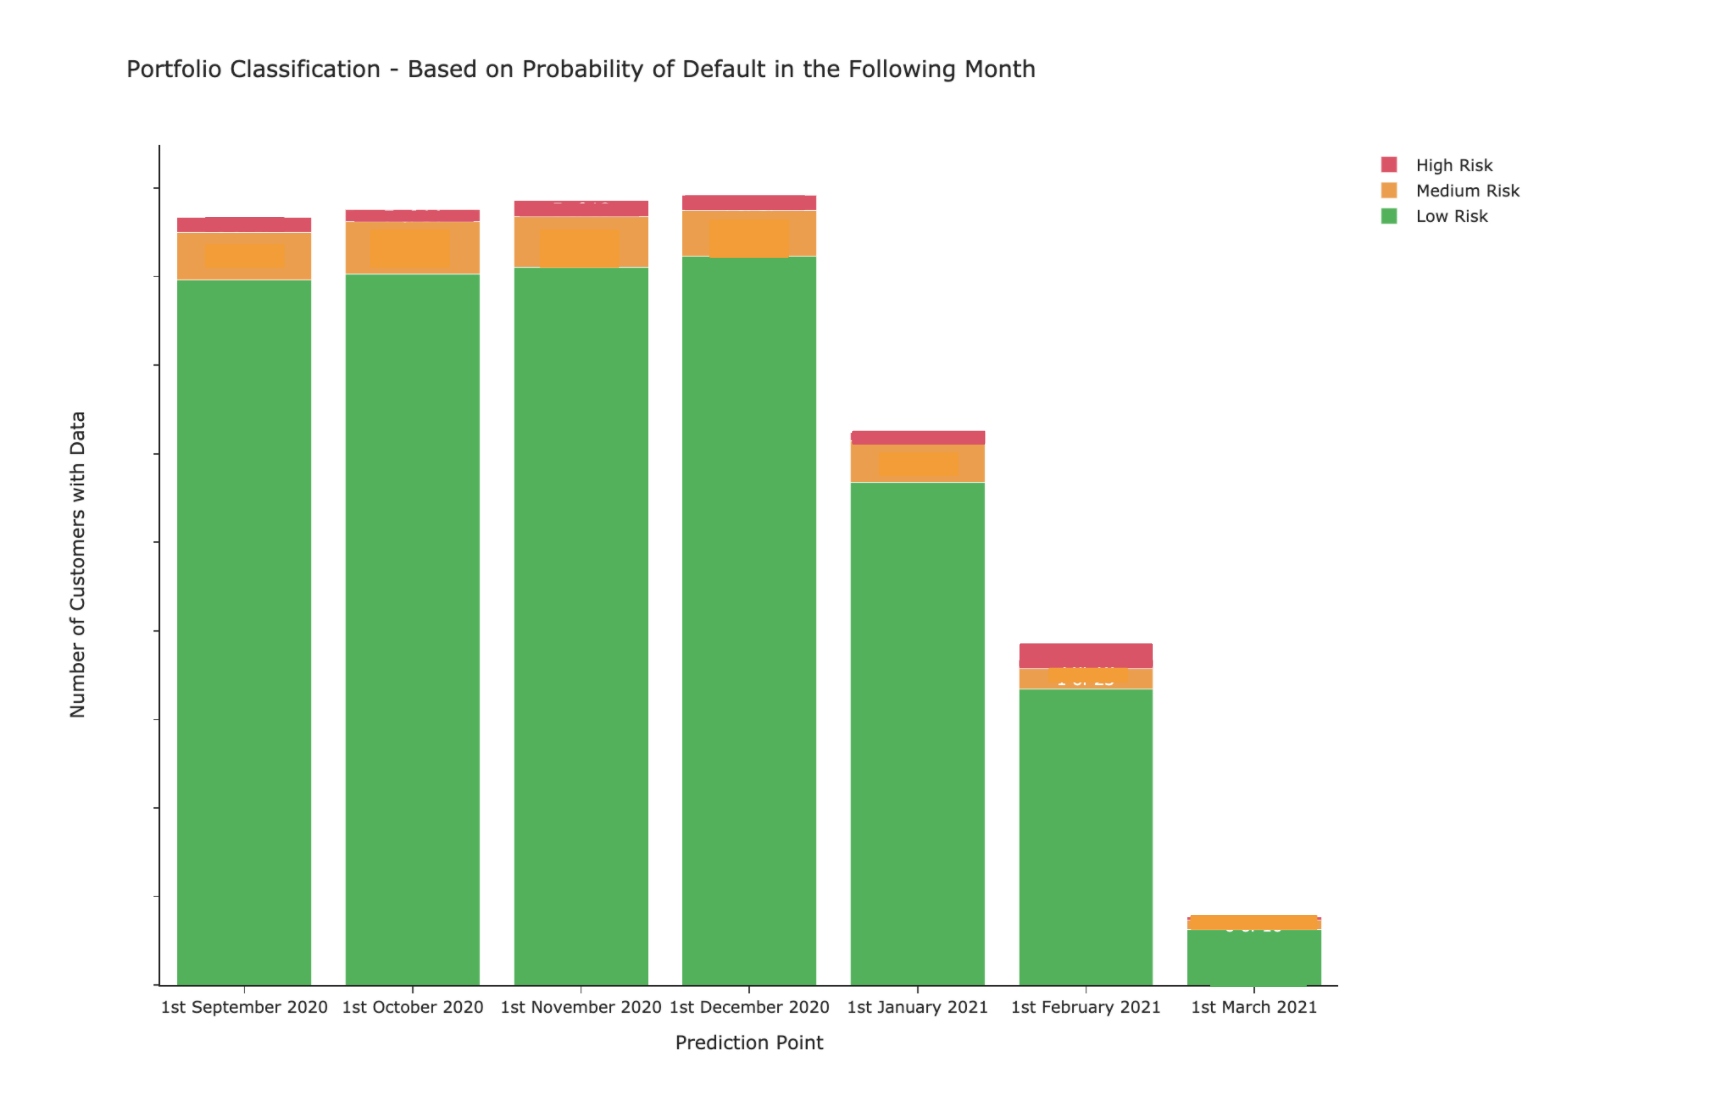
The higher the probability of default for a customer, the higher the credit risk of a specific customer in a specific time frame. As a result, the review system will automatically approve low-risk customers and let credit underwriters manually check medium to high-risk ones to decide whether to reduce their credit limit. The three zones also help them to prioritise the urgency. For instance, the customers in the red zone must be checked immediately, as there is a high chance that they will go into default next month. On the other hand, customers in the yellow zone can be handled if and when they have time. Figure 2 gives an idea of how customers distribute across the three risk zones.
Taking all this together, we can say that after testing the model on six months of data, the results show that 100% of defaults fall either in the medium or high risk zones, but that 74% fall in the high risk zone. This means that by automatically approving all the customers that fall in the green area, Floryn would still be able to catch future defaulting customers that actually need manual financial review and act proactively on them.
To sum up, enhancing the review system with the developed machine learning algorithm would lead to a 23% reduction in the number of manual reviews, thus saving a significant amount of manual work. Ultimately, customers get feedback more quickly and credit underwriters can focus on helping more complicated customers and finding new ones.
Floryn is a fast growing Dutch fintech, we provide loans to companies with the best customer experience and service, completely online. We use our own bespoke credit models built on banking data, supported by AI & Machine Learning.
